
The Solar Access Report is a professional, customer-ready deliverable generated by S-Miles Designer. It combines high-precision remote sensing data with 3D simulation to quantify irradiance and shading losses for any PV project.
1. Core Capabilities
🌍 3D Digital Twin & Environment Replication
The report utilizes high-resolution satellite imagery, Google Street View, and LiDAR data fusion to reconstruct a 1:1 3D model of the client’s property. It accurately captures not just the building structure, but also surrounding shading obstacles like trees and adjacent buildings.
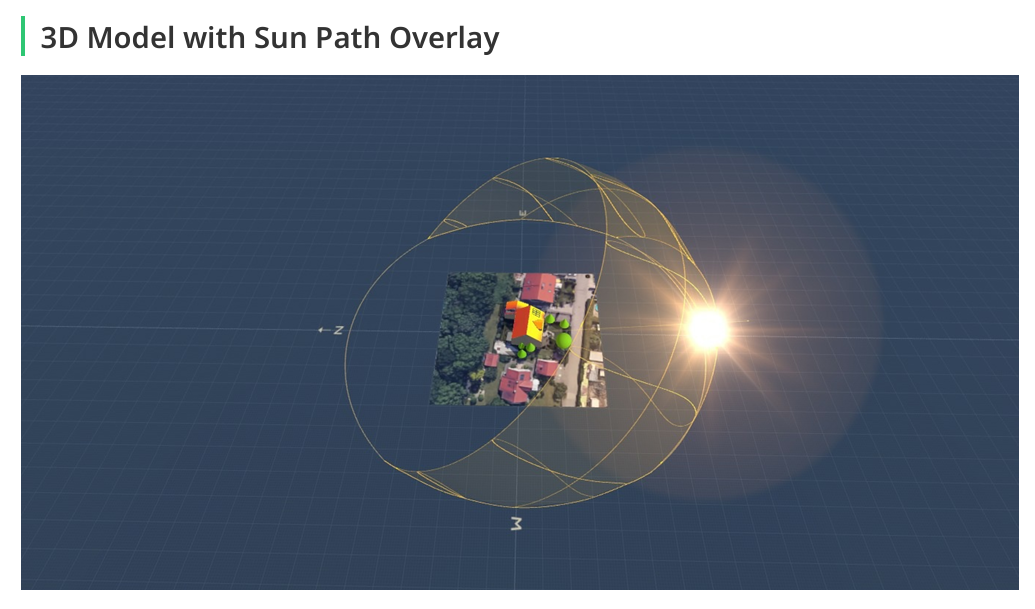
☀️ 365-Day Dynamic Sun Path Simulation
Using a built-in 3D Sun Path Overlay, the engine simulates the exact trajectory of the sun across all seasons. This enables the visual tracking of dynamic shadows throughout the year, ensuring the layout is scientifically backed.
💎 Panel-Level Granularity
The analysis goes beyond rough estimates by evaluating shading losses at the individual module level. It quantifies the exact solar access percentage for every single panel, allowing designers to eliminate underperforming modules before installation.
2. Report Content Sections
A standard Solar Access Report includes the following core data blocks:
Section 1: Annual Irradiance Summary
This section establishes the technical foundation of the project site by detailing:
- Site Metadata: Customer info, specific geographic coordinates, and timestamp.
- Array Configuration: Detailed metrics for each PV array, including module count, tilt angle, and orientation/azimuth.
- Industry Benchmarks: Automatic calculation of industry-standard metrics: Solar Access %: The percentage of solar resource available after accounting for shading obstructions. TOF (Tilt and Orientation Factor): The efficiency of the roof's pitch and heading compared to the ideal orientation. TSRF (Total Solar Resource Fraction): The net efficiency of the system, combining both TOF and Shading losses.
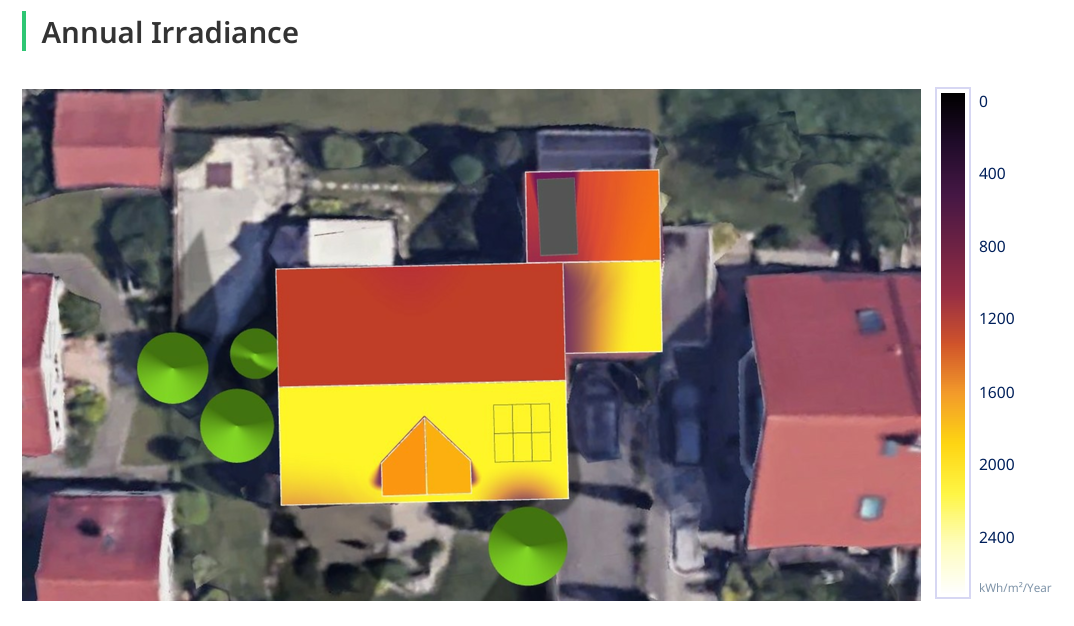
Section 2: Annual Irradiance Heat Map
A visual, color-coded 3D representation of the roof. It maps annual solar radiation ($\text{kWh/m}^2/\text{Year}$) across different roof facets, making it easy for clients to see exactly why certain areas were chosen for panel placement.
Section 3: Monthly Solar Access & Irradiance Breakdown
Provides a side-by-side monthly bar chart comparing Average Irradiance against Shaded Irradiance. It includes a monthly data matrix showing how the array performs season by season, giving clients clear expectations for winter vs. summer generation.
Section 4: Panel Shadow Loss Analysis
A quality-assurance table that categorizes the system's modules into solar access brackets (e.g., $100\%$, $90\text{--}100\%$, $80\text{--}90\%$, etc.). This proves to the customer that the system is optimized for maximum uptime and minimum shading disruption.